Usage History (kWh)
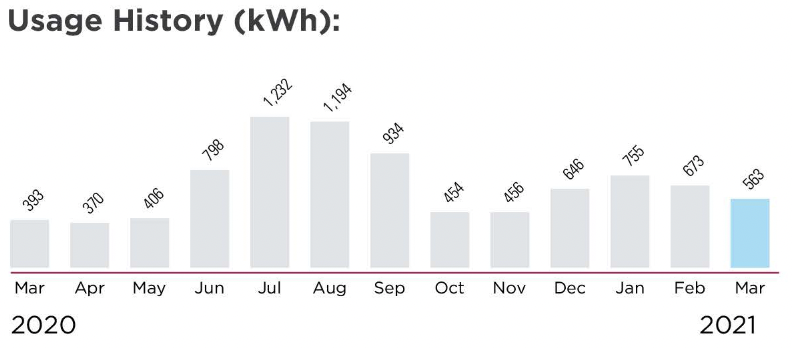
AEP Ohio provides a bar graph to see a 13-month history of energy use for a specific meter. Since the first month and last are stated it’s easy to see how much power is being used for a specific month year over year.
Current Bill Summary
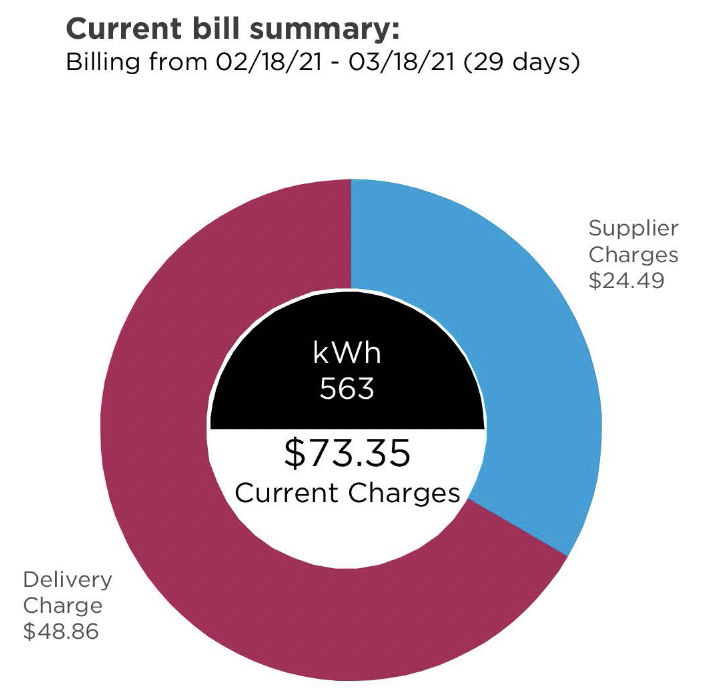
A summary of both kWh and current charges is shown with a visual circle graph of the split between utility charges and supplier charges.
Payment Return slip
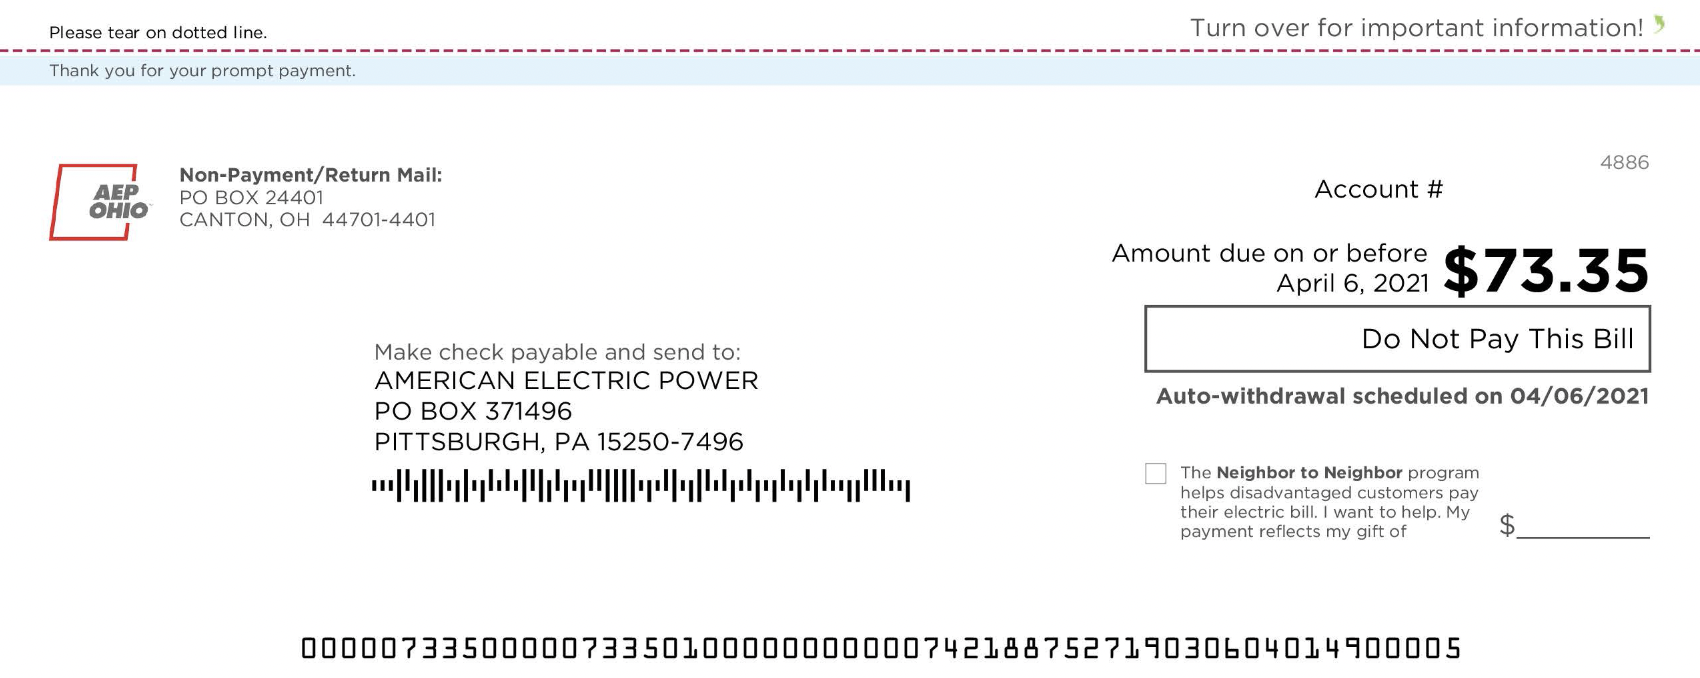
Again, a summary of the total charges paid to AEP Ohio. Note, you pay the full amount to the utility and the utility will make payment to the supplier. One payment.